Tradesea Compass: Why Journaling & Analysis Are Your Edge

And how to actually read your Compass Score
Most traders obsess over entries. The best traders obsess over patterns. Compass exists to surface those patterns, in your numbers and in yourself.
You can't improve what you don't measure. And you can't fix what you haven't noticed.
Journaling: More Than a Record
A journal isn't a diary. It's a feedback loop. Recording what you traded and why (the setup, the emotion, the conviction level) creates the raw material for genuine improvement.
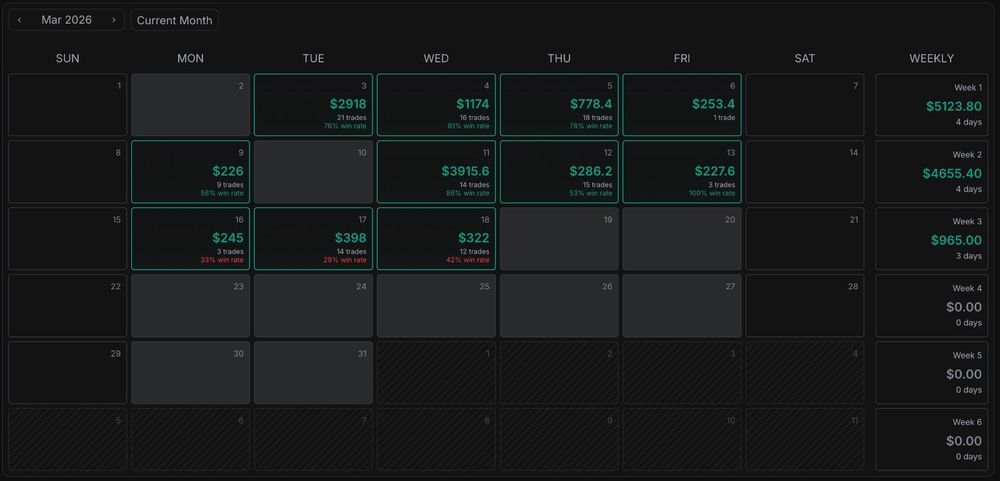
Fig 1: Monthly Trading Calendar: March 2026
The Compass calendar makes this concrete. Week 1: $5,123 profit, win rates 76-81%. Week 2: another $4,655. Week 3: $965, win rates down to 29-42%. Without a journal, a trader blames the market. With one, they find the pattern: overtrading, widened stops, chasing setups that weren't there.
What the Numbers Actually Say
Three metrics from the dashboard, and what each one is really telling you:
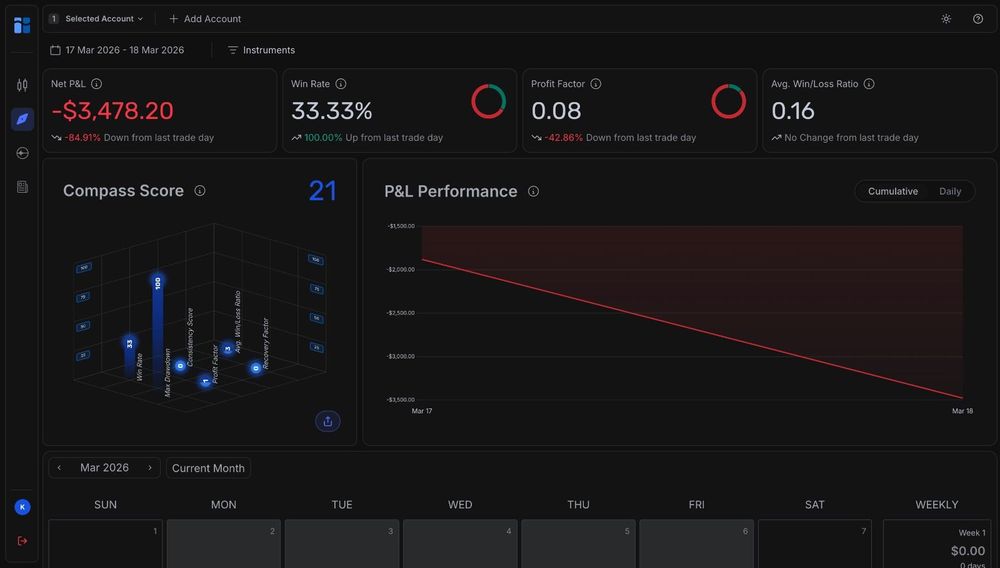
Fig 2: Compass Dashboard: Net P&L, Win Rate, Profit Factor & Compass Score (Mar 17-18, 2026)
Win Rate - 33% Only 1 in 3 trades closed in profit. Alarming on its own, but only dangerous when losses are bigger than wins.
Profit Factor - 0.08 For every dollar made, roughly twelve are lost. Risk management is the priority, not more trades.
Avg Win/Loss - 0.16 Average wins are 16% of average losses. This ratio explains the -$3,478 net P&L. The math doesn't work until it improves.
Reading Your Compass Score
The Compass Score is a single number from 0 to 100 that measures not just whether you're profitable, but whether you're trading well, across six dimensions.
The Six Dimensions
Win Rate: How often you're on the right side of the market.
Consistency Score: Whether your performance is repeatable or random.
Max Drawdown: How deep your worst losing streak goes.
Profit Factor: Gross profit divided by gross loss.
Avg Win/Loss Ratio: Whether your winners justify your losers.
Recovery Factor: How quickly you bounce back from losses.
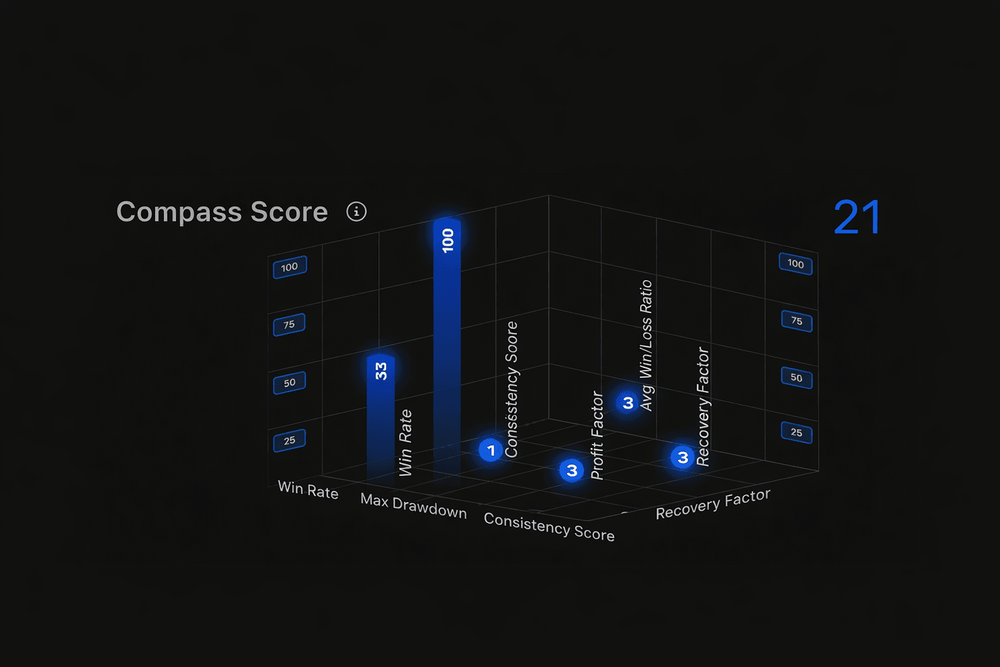
A score of 21 is not a verdict. It's a diagnosis. It tells you exactly where to focus.
In the example above, the score sits at 21. The radar chart shows Win Rate and Consistency as the weakest pillars. The instruction isn't "trade better" ; it's "trade more selectively and stick to setups with proven edge."
From Analysis to Action
Three steps to close the loop between data and behavior:
Review weekly. Win rate, trade count, time of day. Find where your edge was live vs. where you were forcing it.
Name your top 3 losing patterns. Most traders lose the same few ways. Your journal will show which days, instruments, and emotional states coincide with your biggest drawdowns.
Set one rule per week. Not a resolution, a rule. Track whether following it moves your Compass Score over 4 weeks.
Trading Insights: When and How You Trade Best
The Trading Insights panel moves from what happened to why it happened.
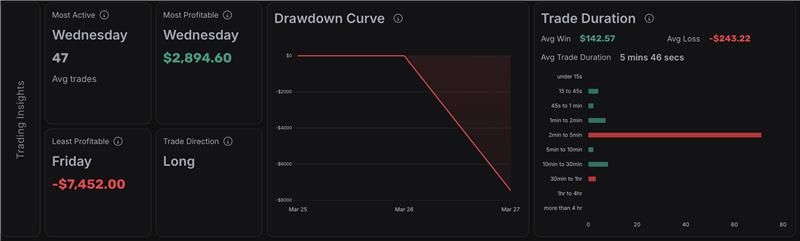
Fig 4: Trading Insights: Most Active/Profitable Days, Drawdown Curve and Trade Duration
Day-of-Week Patterns Wednesday is both the most active (47 avg trades) and most profitable ($2,894.60) day. That's healthy alignment. Friday is the least profitable at -$7,452.00 — a direct instruction to reduce size or set a hard cutoff on that day.
The Drawdown Curve The steep drop between Mar 25-27, reaching -$8,000, was a concentrated loss event, not gradual erosion. Journal that window specifically: setup, market context, position sizing. That's where the answer is.
Trade Duration and Your True Edge The 2-5 minute band is the most active. Cross-reference it with win rate and P&L to find where your edge actually lives. An avg win of $142.57 vs. an avg loss of $243.22 signals the classic trap: cutting winners too early, holding losers too long. The fix is a rule, not a new strategy.
Going Deeper: Notes and Tag
Most traders stop at the numbers. Notes and Tags let you go one level deeper, into the trade itself.
Adding Notes A note per trade is a 10-second habit. Write what you saw, what you expected, and what happened. Over weeks, patterns invisible in the numbers become obvious in the words: overconfidence before big losses, hesitation before missed winners.
Tags and Filtering Tag trades by setup, session, or instrument. Filter by tag and you can instantly compare how your breakout trades perform vs. your reversal trades, or London vs. New York. Most traders never reach the trade detail pages, Tags bring that depth to the surface without the friction.
The Bottom Line
A score of 21 and -$3,478 over two days isn't a reason to stop trading. The first three weeks proved the edge exists: $9,744 across 10 trading days. The issue isn't the strategy. It's the discipline to apply it consistently. That's what journaling reveals. That's what Compass measures.
Track every trade. Review every week. Improve every month.